Open the RJE Configuration Utility.
Select the Communication Link tab.
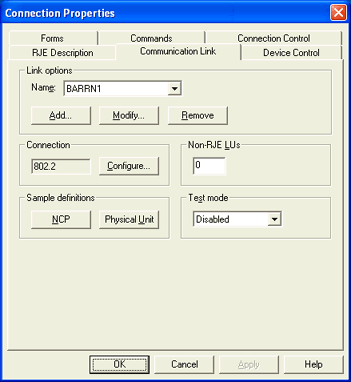
Under Link options, select an 802.2 link and click Modify.
The BARR/SNA 802.2 Link Service utility displays.
Select the type of file you would like to include with the diagnostics.
If you have communication problems, you can capture an 802.2 trace.
Complete the following steps to generate a program trace.
Open the RJE Configuration Utility.
Select the Communication Link tab.

Under Link options, select an 802.2 link and click Modify.
The BARR/SNA 802.2 Link Service utility displays.
From the Trace tab, select Trace enabled.
Specify the Trace format, either long or short, and the Max tracefile size.
Recreate the problem or software event.
Clear the Trace enabled check box to stop the trace. The trace results are saved to a text file. By default, the file will be saved in the \\Program Files\Common Files\Barr\Trace folder.
Click OK or Cancel to close the utility.
Capture diagnostics with the Diagnostics Utility. This file will be automatically included.
If you have communication problems, you can capture an HPR/IP trace.
Complete the following steps to generate a program trace.
Open the RJE Configuration Utility.
Select the Communication Link tab.

Under Link options, select an HPR/IP link and click Modify.
The BARR/SNA HPR/IP Link Service utility displays.
From the Trace tab, select Trace enabled.
Specify the Trace format, either long or short, and the Max tracefile size.
Recreate the problem or software event.
Clear the Trace enabled check box to stop the trace. The trace results are saved to a text file. By default, the file will be saved in the \\Program Files\Common Files\Barr\Trace folder.
Click OK or Cancel to close the utility.
Capture diagnostics with the Diagnostics Utility. This file will be automatically included.
If you have communication problems, you can capture an SDLC trace.
Complete the following steps to generate a program trace.
Open the RJE Configuration Utility.
Select the Communication Link tab.

Under Link options, select an SDLC link and click Modify.
The BARR/SNA SDLC Link Service utility displays.
From the Trace tab, select Trace enabled.
Recreate the problem or software event.
Clear the Trace enabled check box to stop the trace. The trace results are saved to a text file. By default, the file will be saved in the \\Program Files\Common Files\Barr\Trace folder.
Specify the Trace format, either long or short, and the Max tracefile size.
Click OK or Cancel to close the utility.
Capture diagnostics with the Diagnostics Utility. This file will be automatically included.
If you have communication problems, you can capture a CHANNEL-OUT trace.
Complete the following steps to generate a program trace.
Open the BARR/CHANNEL-OUT utility.
Select the Tracing tab.
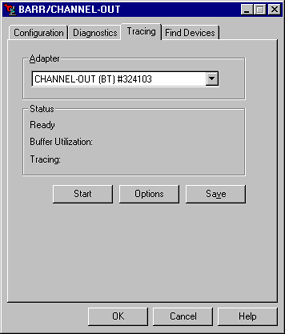
Click Start.
Print a file to a PRINT390 printer.
Click Stop when you are finished tracing.
Click Save.
In the File name box, type the file name and click Save. By default, the file will be saved in the \\Program Files\Common Files\Barr\Trace folder, unless an alternate path is specified.
Run the Diagnostics Utility and add this trace file. You can use the Windows Find feature to search for the trace file. For more information, see the Microsoft Help.
Open the BARR/PRINT TCP/IP Configuration utility.
Select the LPD tab.
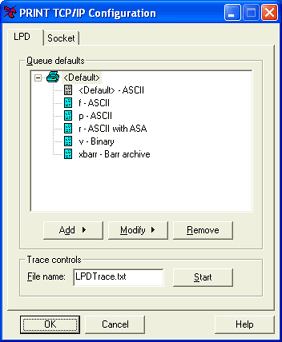
Under Trace controls, verify the File name of the trace file.
Click Start.
Receive a file with LPD.
Click Stop when you are finished tracing. The trace file is automatically stored in the \\Program Files\Common Files\Barr\Trace folder.
Leaving the LPD trace running can greatly degrade performance. The LPD trace is intended as a diagnostic tool only and must not be used in production settings. If you close the BARR/PRINT TCP/IP Configuration utility while the trace is running, a message will ask you if you want to stop the trace.
Capture diagnostics with the Diagnostics Utility. This file will be automatically included.
Open the BARR/PRINT TCP/IP Configuration utility.
Select the Socket tab.
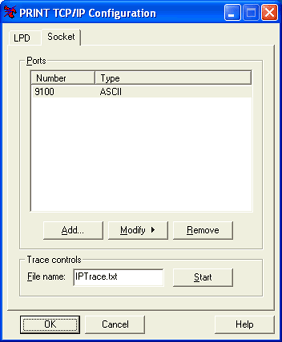
Under Trace controls, verify the File name of the trace file.
Click Start.
Receive a file with TCP/IP socket.
Click Stop when you are finished tracing. The trace file is automatically stored in the \\Program Files\Common Files\Barr\Trace folder.
Leaving the trace running can greatly degrade performance. The trace is intended as a diagnostic tool only and must not be used in production settings. If you close the BARR/PRINT TCP/IP Configuration utility while the trace is running, a message will ask you if you want to stop the trace.
Capture diagnostics with the Diagnostics Utility. This file will be automatically included.
Open the Spool Window.
Right-click the job you want to include in the diagnostics.
Select Add to Diagnostics.
Run the Diagnostics Utility.
Open the BARR/PRINT TCP/IP Configuration utility.
Click Add and type a queue name where LPR can print.
Click Add to define the queue.
From the File type list, choose <Default>.
Under Receive as, select Binary (raw).
Click OK.
Using LPR, send a file to the queue name added in step 2.
Use one of the following methods to send the file to Barr Technical Support.
If you have Internet e-mail access, e-mail the file to support@barrsystems.com.
If you do not have Internet e-mail access, you can manually send the file.
Open the Diagnostics Utility.
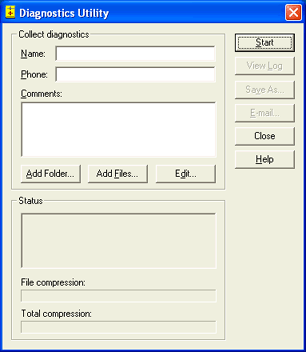
In the Name box, type the name of the contact person. This is a required field.
In the Phone box, type the phone number of the contact person. This is a required field.
In the Comments box, type your assigned problem tracking number and a brief description of the problem.
Click Add Files and select the resulting file that was written to disk.
Click Start. The status of the progress of the diagnostics being gathered will be indicated in the Status box. The name and location of the compressed Reduced the amount of space or bandwidth needed to store or transmit a block of data. Data compression is also called data compaction. .bct file will display, indicating that all diagnostics have been collected.
To view the details of the diagnostics, click View Log.
To save the BarrDiag.bct file to an alternate location, click Save As. This is useful because the BarrDiag.bct file is saved to a hidden folder by default.
Use one of the following methods to send the files to Barr Technical Support.
If you have Internet e-mail access, click E-mail to e-mail the file.
If you do not have Internet e-mail access, you can manually send the file.
Open the Diagnostics Utility.

In the Name box, type the name of the contact person. This is a required field.
In the Phone box, type the phone number of the contact person. This is a required field.
In the Comments box, type your assigned problem tracking number and a brief description of the problem.
Click Add Files and select your original file before it was sent to the spool.
All trace files located in the \\Program Files\Common Files\Barr\Trace folder will be included in the diagnostics. Once the files are included in the trace, they will be moved to the \\Program Files\Common Files\Barr\Old Trace folder. If a file with the same name exists in the Old Trace folder, the existing file is replaced with the new file.
Click Start. The status of the progress of the diagnostics being gathered will be indicated in the Status box. The name and location of the compressed Reduced the amount of space or bandwidth needed to store or transmit a block of data. Data compression is also called data compaction. .bct file will display, indicating that all diagnostics have been collected.
To view the details of the diagnostics, click View Log.
To save the BarrDiag.bct file to an alternate location, click Save As. This is useful because the BarrDiag.bct file is saved to a hidden folder by default.
Use one of the following methods to send the files to Barr Technical Support.
If you have Internet e-mail access, click E-mail to e-mail the file.
If you do not have Internet e-mail access, you can manually send the file.