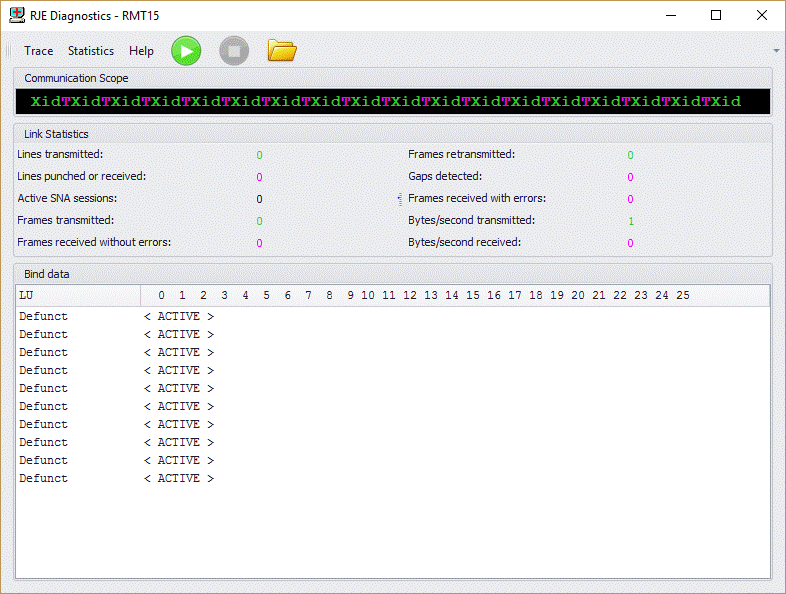
Use the RJE Diagnostics utility to monitor communication between the personal computer and the host computer. If you have trouble operating RJE and contact Barr technical support, a support analyst might request that you run the RJE Diagnostics utility to determine the cause of the problem.
Click the area of the window you want to learn more about.

The menu bar displays below the title bar. Click the following menus to learn about the available commands.
This menu is not available for MS/LUA connections. You must capture MS/LUA traces from either Microsoft SNA Server or HIS. Refer to the appropriate Microsoft Help for more information.
On -Starts tracing the operation.
Off - Stops tracing the operation.
Clear– Clears the contents of the trace file.
Reset – Resets the communication scope and link statistics.
Contents and Index– Opens the Help.
Barr Systems on the Web– Opens the Help with links to the Barr Systems Web page.
The toolbar provides quick access to commands.

Start Trace – Starts tracing the operation. This option is not available for MS/LUA connections. You must capture MS/LUA traces from either Microsoft SNA Server or HIS. Refer to the appropriate Microsoft Help for more information.
Stop Trace – Stops tracing the operation. This option is not available for MS/LUA connections. You must capture MS/LUA traces from either Microsoft SNA Server or HIS. Refer to the appropriate Microsoft Help for more information.
Open Trace Folder – Opens to the default Trace Folder location. This option is not available for MS/LUA connections. You must capture MS/LUA traces from either Microsoft SNA Server or HIS. Refer to the appropriate Microsoft Help for more information.
The communication scope displays detailed information about the communication between the personal computer and mainframe.
When you start an RJE connection, RJE tries to connect with the mainframe and then log on. For a dial-up connection, you can see dial-up characters on the communication scope and logon error messages on the console. After RJE connects with the mainframe, the mainframe and remote exchange frames of information. You can use either character color or position to learn more about the communication.
In the color mode, colors indicate whether the activity comes from the computer or the mainframe. The colors that display match the colors configured in the RJE Console window. By default, when RJE sends a message to the mainframe, green characters appear and when RJE receives a message, magenta characters appear. In the Help, the sent message appears in normal text and the received message appears in reverse video (white text with a black background).
In the monochrome mode, the placement of the characters indicate whether the activity comes from the computer or the mainframe. When RJE sends a message to the mainframe, the characters appear across the top of the communication scope. When RJE receives a message, the characters appear across the bottom of the communication scope. In the Help, the sent message appears in normal text and the received message appears in reverse video (white text with a black background). For a dial-up connection, dial-up scope characters display across the middle of the communication scope.
See the Interpreting RJE diagnostic data topic for a detailed explanation of all communication scope characters.
To display or hide the communication scope, on the menu bar, select View | Communication Scope.
To reset the communication scope and the link statistics, on the menu bar, select Statistics | Reset.
Link statistics provide information about communications activity. These statistics help you evaluate the communication line’s reliability and use. The link statistics vary depending on your connection type (HPR/IP or MS/LUA). See the Interpreting RJE diagnostic data topic for a full explanation of link statistics.
To display or hide the link statistics, on the menu bar, select View | Link Statistics.
To reset the link statistics and the communication scope, on the menu bar, select Statistics | Reset.
In SNA communications, bind data defines the operational rules for each party on the session. The bind data originates from the VTAM LOGMODE table, the PU definition, and the RJE system. JES2 parameters override LOGMODE parameters for the bind data. See the Interpreting RJE diagnostic data topic for a full description of bind data.